As an online business grows in popularity it can highlight scalability problems in your architecture. Certain hardware and/or software components can struggle to keep up with increased demand and it may not be easy or cost-effective to address this by extending them in their present form, especially when the demand is spiky in nature. My team was recently faced with such an issue. We decided to engineer our way out of the problem by designing a more scalable replacement solution. Key technical requirements for the new solution included the throughput and latency of a public web API. In this post I share details of how you can measure these performance characteristics of an API using Apache JMeter, and in the process I identify a very useful supporting JMeter plugin.

JMeter – Throughput per second graph
Background
I’ve been using Apache JMeter on and off for several years and found it to be a good tool for black-box load testing web APIs. The no. of components, and some of the terminology used, means there’s a learning curve for the tool, but once you get your head around these there’s a payoff in terms of the flexibility you get bolting together components to produce test plans. When it comes to running tests, I’ve also found JMeter to be reliable and accurate. To date I’ve used the tool to successfully soak test new web services, simulate load generated by API clients, and get a good feeling that new APIs are performing well, in terms of their response times, before deploying them to production.
Given these good past experiences, JMeter was my tool of choice when needing to test the performance and scalability of a prototype of a new, more scalable solution that was exposed by a public web API. Some of the technical requirements for the solution that needed to be tested included:
- achieve and sustain a minimum throughput; and
- scale beyond the min throughput, quickly enough to absorb known spikes in API calls.
What is throughput?
Put simply, throughput is the rate at which work can be done. In the case of a web API, it’s the rate at which API calls can be processed. More specifically, it’s the average no. of requests that can be successfully processed per second or minute, over a given duration.
So how do you go about testing the throughput of an API, and how quickly it can scale? And how is this best implemented in JMeter?
Required Test Plan
To test the solution met requirements for throughput and scalability a multi-phase test was needed. Each phase needed to test whether the same API could achieve and sustain a specific throughput, with some challenging (intense) spikes thrown in. The throughput and the size of the spike was stepped up higher in each phase. For example –
Phase 1 – 10 req/sec + spike
- Ramp-up from 1 to 10 req/sec over 5 mins, and hold for 5 mins.
- Spike – Throw in an intense spike of 50 req/sec for 10 secs. (This requires the solution to scale to 5 times the current throughput in the space of 10 secs).
Phase 2 – 50 req/sec + spike
- Ramp-up from 10 to 50 req/sec over 5 mins, and hold for 5 mins.
- Spike – Throw in a spike of 100 req/sec for 10 secs. (This requires the solution to scale again to double the current throughput in the space of 10 secs).
Phase 3 – 150 req/sec + spike
- Ramp-up from 10 to 150 req/sec over 5 mins, and hold for 5 mins.
- Spike – Throw in a higher spike of 200 req/sec for 10 secs.
Initial Solution – Scripted JMeter Constant Throughput Timer
JMeter’s out-of-the-box Timer components are used to introduce delays before or after threads execute a Sampler. The Constant Throughput Timer is specifically designed to support executing a Sampler at a specified throughput (samples per minute) by introducing variable pauses across all the plan’s executing threads. Given a sufficient no. of threads, this class of Timer will try to maintain a desired rate of samples (API calls) to test whether your API can achieve the desired throughput. Although the Timer is described as “Constant”, the throughput value can be dynamically changed during a test by specifying a variable.
You can therefore implement a test plan which tests whether your web API can achieve and sustain various, higher levels of throughput over time as follows –
- Add a Constant Throughput Timer to your Thread Group, and configure its “Target throughput” in terms of a variable.
- Add a BeanShell Post Processor to your HTTP Request Sampler for the API call, which alters the value of the Timer’s throughput variable, stepping it up and down at configured elapsed intervals in the test.
An (incomplete) example implementation of such a test plan is shown below –

JMeter Test Plan – Constant Throughput Timer and script
The BeanShell script shown in the example above only supports stepping up the throughput once. It would be simple to extend the plan to support the required additional step-ups in throughput by adding “{api-name}Throughput{n}” variables and enhancing the script. And you could then extend the script further still to throw in the desired spikes in API calls. However, there is a better way, which not only removes the need to write a script, but also adds some other nice features.
Improved Solution – Throughput Shaping Timer
The JMeter Plugins project provides extra features for JMeter in the form of additional, contributed components including Graphs, Thread Groups, Timers, Listeners and Samplers. These components are packaged as a few different ‘plugin’ distributions, which vary depending on how commonly they’re needed and what additional dependencies they have. The “Standard” plugin distribution contains the most commonly used components. It has no additional dependencies, making it simple to install. All you need to do is unpack the zip file, which contains a few extra contributed JARs, to your JMeter install.
One of gems in the Standard plugin distribution is the Throughput Shaping Timer. As its name suggests it’s a Timer component which, like the out-of-the-box Constant Throughput Timer, is designed to support testing throughput. However, it is much simpler to use and supports writing more flexible tests. The component supports configuring a ‘schedule’ of required throughput – multiple throughputs which start at a specified elapsed time and last for a specified duration. A UI is provided which allows you to configure the schedule interactively, removing the need to write a script to vary the throughput e.g. –

JMeter Throughput Shaping Timer – Schedule
When the configured schedule completes, so does your test plan. Another nice feature the UI provides is a visualisation of the configured required throughput schedule in the form of a graph of Throughput (req/sec) over Elapsed Time, e.g. –
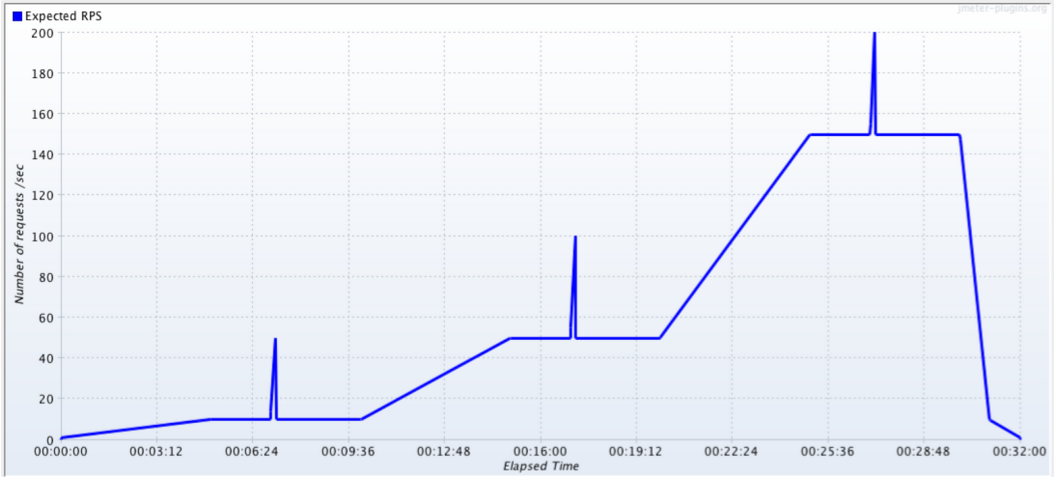
JMeter Throughput Shaping Timer – Required Throughput Graph
Using the Throughput Schedule Timer I was able to re-implement my test plan without the script, as shown below.
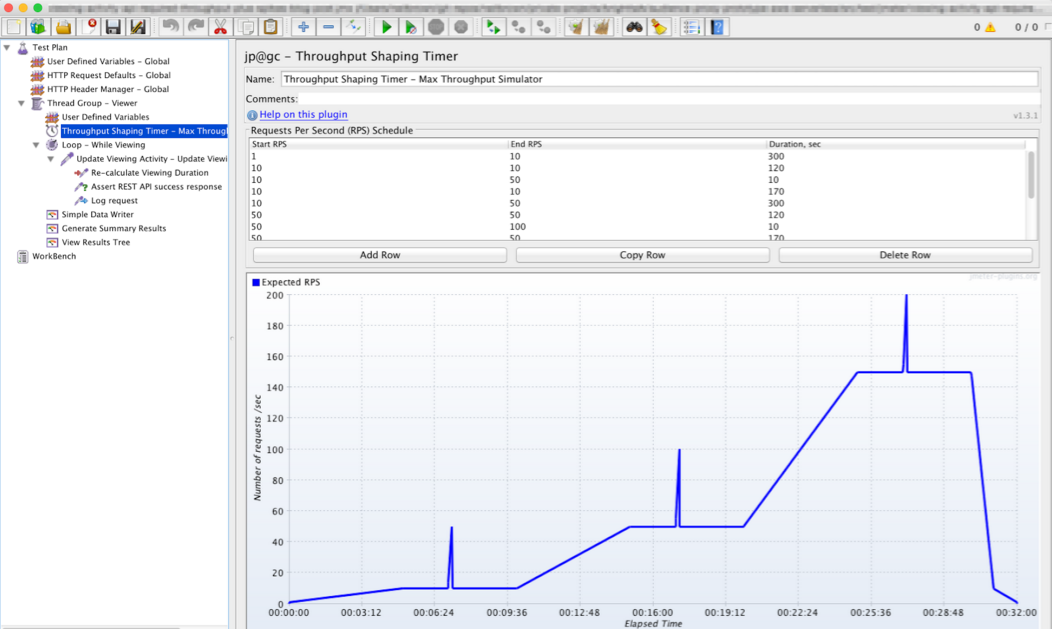
JMeter Test Plan – Throughput Shaping Timer
Plus this time, as shown above, I was also able to throw in spikes of API calls to test how well they could be absorbed by the API – i.e. what spare capacity it has to scale.
Calculating the Required Threads
Regardless of which component you use to implement your throughput test, JMeter will only be able to achieve the target throughput if you execute your test plan (HTTP Sampler) with sufficient threads. The no. of threads you’ll need depends on the response time of your API, and can be estimated using the following simple formula –
Required threads = required throughput (req/sec) / max API response time (sec)
For example, if an API’s max response time = 0.5s, then to achieve a throughput of 100 requests / second, the no. of threads needed ~= 100 / 0.5 = 200.
Analysing The Results
An added bonus of the Standard plugin distribution is that it also includes a couple of additional Graphs which are useful for analysing the results of a throughput test.
The Throughput per second graph can be used to generate a graph of the actual throughput that was achieved during the test. This graph is the same one used by the Throughput Shaping Timer to visualise the required (or scheduled) throughput, but it also displays and differentiates failed (e.g. rate limited) API calls as well as successful ones, e.g. –
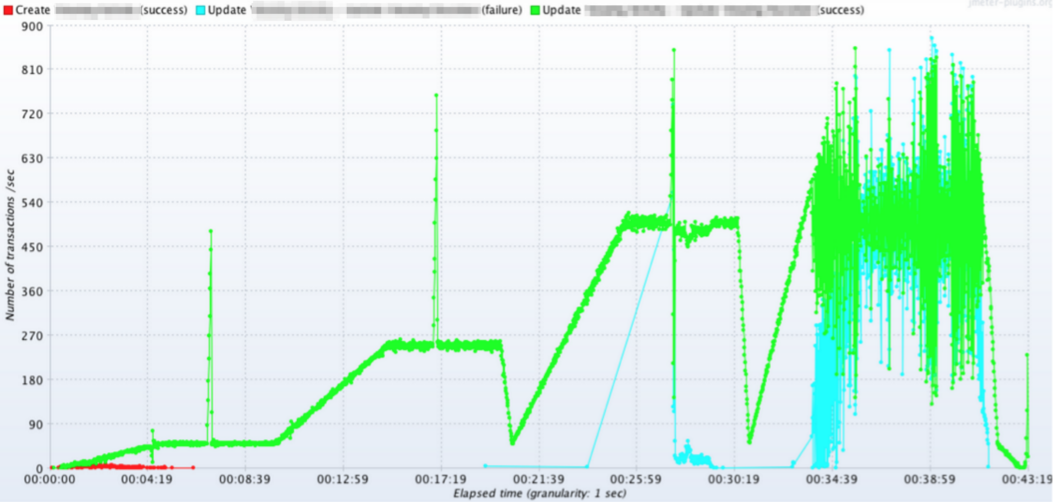
JMeter – Throughput per Second graph
Comparing the two versions of the graph side by side provides a visual indication of how closely your API achieved the required throughput.
The Response Times over Time graph helps you visualise the average response time (latency) of your API calls over the course of the test. For example –

JMeter – Response Times over Time graph
This graph provides a useful visual supplement to the scalar value of the average throughput achieved over the test as reported in the Aggregate Report or Summary Report.
Conclusion
You can reliably and accurately measure the throughput of your web API(s) using JMeter.
When testing throughput using JMeter the Standard plugins distribution is definitely worth installing. It provides the Throughput Shaping Timer which makes building a throughput test much easier. It also supports creating more sophisticated tests e.g. to simulate production load, including spikes, by allowing you to schedule changes in throughput over time. As an added bonus the plugin distribution also includes some additional graphs that allow you to visualise and compare actual and required throughput, and also the latency (response time) of your API.
A big thanks to those people that continue to develop and maintain JMeter, and also to those people who built and have contributed to the Standard plugins distribution.
