When my team and I first took on responsibility for modernising our business’ backend application services, we found it was hard to obtain a full picture of the events that were being logged by services, in a timely manner. Logging of events are an essential source of data for monitoring how a service is operating, and also to support troubleshooting of problems e.g. the no. and rate of failed API requests, and supporting failure diagnostics. Therefore, one of the first tasks we prioritised as a (devops) team was to improve this situation by provisioning a modern log aggregation and search solution. This post outlines the problems we addressed, the architectural pattern we used as the basis of the solution, the tools we used to implement the pattern, and the resulting benefits.
The Problem
There are two essential parts to an effective logging solution for application services, which are the responsibility of both developers and operations staff –
- Consistent logging of noteworthy events that occur during the execution of a service, at an appropriate priority/severity. This is the responsibility of service developers and is implemented by adding log statements to the application code.
- Logging infrastructure that supports storing, searching and viewing the logged events. Operations staff are responsible for provisioning and maintaining this infrastructure. (This may be your own staff if the infrastructure is managed in-house, whether deployed on-premise or on compute nodes in the Cloud. Or it may be outsourced, if you purchase the infrastructure as a managed service).
In our case, there were no real problems with the first part of the solution. The dev team had instrumented their (Java) services to log noteworthy events, writing logs at appropriate (error, warning, info, debug) severity, using one of the de facto standard logging libraries (Log4J). And each service was using a unique identifier for the source of a logged event to facilitate filtering of events by service.
With regards the logging infrastructure, the good news is that there was some. Specifically, the application services were not reliant on the basic approach of logging their events to files on a local filesystem. The operations team had already gone as far as setting up a central Syslog server/daemon, and services were logging their events to the remote server using a Syslog client packaged with the 3rd party logging library. As a result, we were at least not suffering from islands of log data – where logged data was only accessible by logging into each node on which a service was running. However, all the problems we were experiencing with finding and viewing logs were still due to limitations in the current logging infrastructure.
Lack of Log Aggregation
For most of our application services there are multiple instances of the service deployed across several nodes to satisfy requirements for availability and scalability. And whilst the logs were being written to central log server, the logs were being written to a node specific log file (node01, node02…node<n>). This lack of aggregation of logs across service instances made it cumbersome, and more difficult than it should be, to view and analyse the full picture of logged events in terms of all the events being logged across all instances of the service. Ultimately it was necessary to consult (tail) multiple log files.
There was also a lack of aggregation of logs written by different services. Processing an external API request for example often involves the coordinated use of several components – web-proxies and one or more application services. In order to efficiently troubleshoot the failure of such a request you sometimes need to be able to view logs written by all these individual components, in created order.
Inability to View & Search Logs in a Simple & Responsive Manner
Originally the log infrastructure for the current solution didn’t provide any support for viewing and searching application logs. Developers were required to log into the central log server, find the relevant (current or past) log files for all relevant nodes for the service in question, and use Linux command line tools, such as tail and grep, to view and search for logs of interest. Whilst these command line tools are powerful and flexible in the right hands (typically those with sysadmin skills), they’re too low-level, and it’s a clunky manual process.
More recently the operations team had made an attempt to address this problem, by providing some support for searching and viewing logs via a web UI. The logging infrastructure was extended to additionally ingest / import the log files into a log server known as LogAnalyzer – 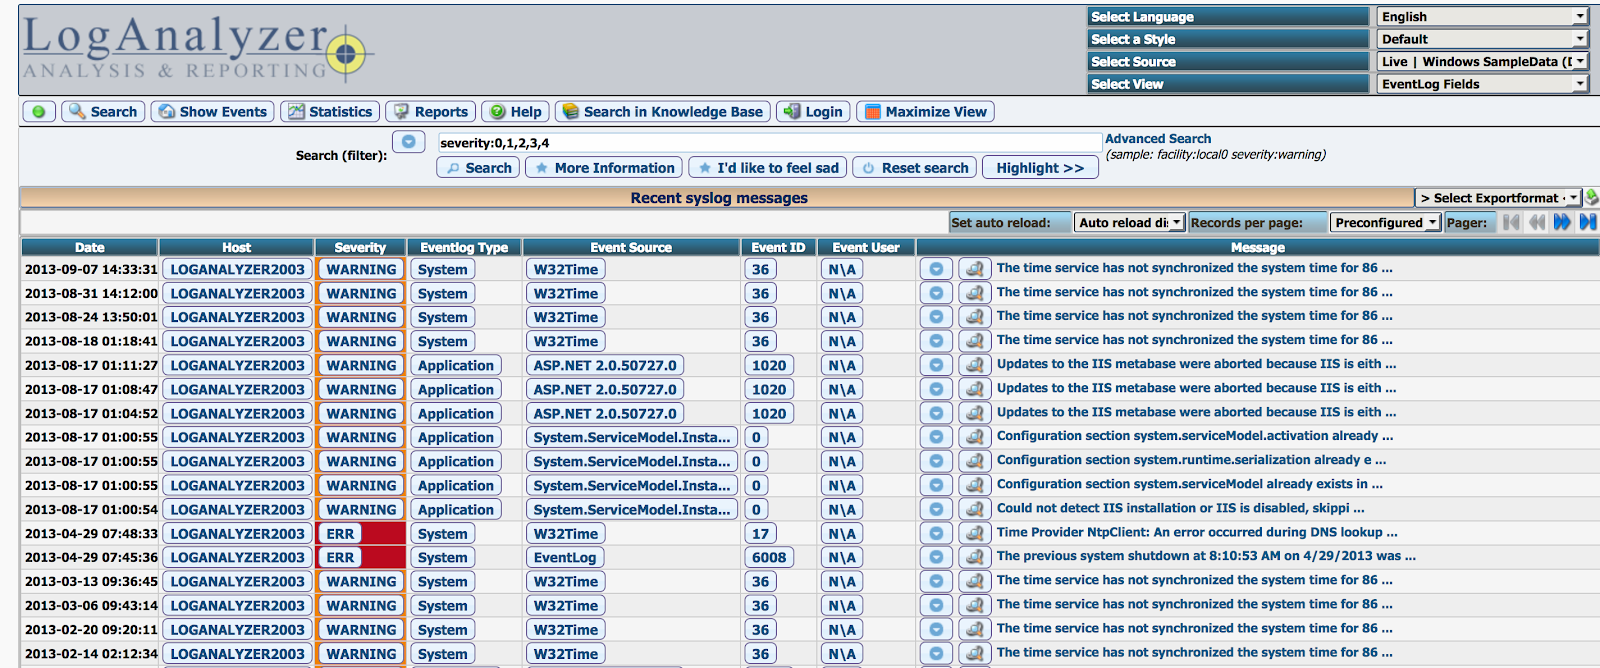 Whilst this was a step in the right direction, in practice the implementation suffered from the following problems and limitations –
-
- Poor Performance – Filtering and searching logs via the LogAnalyzer UI was extremely slow and requests often timed-out, making it unusable on occasions. The volume of logs our system was generating was fairly low (MB per day), so this should not have been a contributing factor. LogAnalyzer was configured to use a MySQL database to store the ingested syslog records, and I suspect the performance problems were due to the database queries not having the required table indexes to support the specified filters and searches. This problem was therefore quite likely to have been caused by our instance of LogAnalyzer not having been properly setup, but MySQL may not be the best tool for this job.
- Basic Web UI – Having a central log server with a web UI that supports viewing and searching logs written by all service instances was a big improvement, however that’s as far as LogAnalyzer’s web UI goes. There is no support for customising the UI and building dashboards for displaying headline log metrics or graphs of numbers of logs.
Even allowing for the fact that some of the above problems may have been specific to our installation of LogAnalyzer, it was apparent there were now better (more scalable and feature-rich) products available for implementing a log server.
Lack of Real-time Monitoring of Logged Events
The current solution supports reporting of logged errors and warnings on a daily basis. A batch job runs every 24 hours on the log server, which (using the Linux logwatch utility) processes the per node log files of each service and produces a report containing all the entries with a severity/priority of error or warning, and emails the report to team members.
This solution fell short of our needs for monitoring events logged by application services in the following respects
- Not Real-time – The solution described above is retrospectively reporting errors and warnings up to 24 hours after they’ve happened. We needed a monitoring solution that would notify us of logs that are likely to indicate problems with a service in near real-time, shortly after they happen, so the team could respond quickly to minimise the impact on users.
- No configurable matching of logs – Support for real-time monitoring could have been partially addressed by scheduling the existing batch job to run more frequently. However, the solution still lacks support for specifying other criteria for matching logged events. Matching on log priority/severity is the very minimum required. It would be useful to be able to suppress monitoring of some warnings, and send a notification if the rate of a logged error or warning exceeds a configured threshold.
Solution Outline
We needed a better solution for searching, viewing, analysing and monitoring logs written by multiple services in a distributed systems architecture. Specifically one that provided a single, central web UI; offered better performing searches; supported building dashboards for heads-up, real-time displays of log metrics; and supported alerts & notifications.
Log Infrastructure Architecture
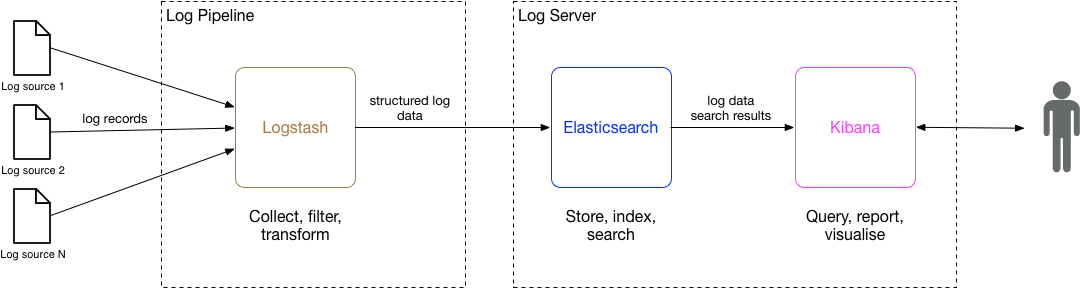
With the increasing popularity of the microservices architecture, our requirements have become common, and a pattern for the logging infrastructure that is required to underpin such a solution has been established. The diagram below shows a logical view of the major components of this logging infrastructure –
Services – The system’s back-end services write logs to a configured type(s) of log destination (‘sink’), using a suitable client/appender provided by the logging library. In our case, our existing services currently send their logs direct to a remote syslog server using a client provided. However, for newer services, especially those that run in a container (e.g. Docker), it is now becoming more common to configure them to just log to stdout and have the container host or logging infrastructure (an agent deployed on the service instance’s node) decide on the destination to which to forward the logs. For example, a service’s Docker host/daemon or individual container, may be configured with a log-driver, such as syslog or journald.
The log infrastructure, provisioned and/or managed by your ops team, comprises 2 major components – a Log Pipeline and Log Server.
Log Pipeline – The Log Pipeline is responsible for collecting (or ‘aggregating’) all of the service logs from each of the utilised log destinations (pipeline inputs) on an ongoing basis, processing then, and ‘forwarding’ them to the Log server. The pipeline then comprises one or more defined steps for processing each received logged event. At minimum this will entail parsing the log entry and converting it to format expected by the Log Server. Other steps in the pipeline may include filtering out unwanted types of logs; and/or enriching logged events with additional info (e.g. source node name/IP) that may not be present in the original log record/entry. Ultimately the Log Pipeline sends each processed logged event to a centralised Log Server, using its API.
Log Server – The Log Server is responsible for providing an API for receiving logs from the Log Pipeline and storing them. It also provides an API and/or UI that supports client systems and end users filtering, searching, retrieving and viewing logs. To support this in an efficient and responsive manner the Log Server must index the fields of the log entries. Finally, a Log Server will ideally also support users defining alerts that are to be triggered under various conditions, and notifying them of those alerts via various transports (e.g. email, HTTP webhooks, etc). Common types of alerts include the log priority and/or message matching a certain pattern, and/or the rate at which the logs are written exceeds a specified threshold.
Log Infrastructure Implementation
As described above, our current log infrastructure included an implementation of a Log Server (Log Analyzer) but it had a no. of deficiencies and limitations. This was the primary area of the solution that needed to be improved. (There wasn’t much of an existing Log Pipeline to speak of – services wrote their logs to a central syslog server, and node log files were imported into LogAnalyzer on a regular basis). Fortunately, in the last few years several popular products have been created to implement a Log Pipeline and Log Server. We chose to adopt one of the most popular, open-source solutions – the “ELK” stack. The ELK stack comprises 3 tightly integrated components –
- Elasticsearch – An open-source scalable, data-store and full text search engine. Data to be searched (‘documents’) is indexed and stored in a distributed data-store. Search operations are accessible via both a RESTful web API and client libraries/SDK.
- Logstash – An open-source data-ingestion / processing pipeline tool, specifically designed for building log processing pipelines. Logstash is able to transform logged events using predefined templates and load data into Elasticsearch.
- Kibana – An open-source data analytics and visualization tool for data stored in Elasticsearch. Provides a web UI for filtering, searching and viewing stored data (such as logs). Also provides tools for building custom dashboards for visualising data using web components such as counters for metrics, and various types of charts (e.g. histograms, line graphs, pie charts).
When these 3 components are used together, they provide a full-stack implementation of the logical log infrastructure described above. Logstash implements the Log Pipeline, while Elasticsearch and Kibana together provide the Log Server –
Visualising, Searching and Viewing Logs in Real-time
Having built a new logging infrastructure based on the ELK stack we then went on to leverage Kibana to build custom log dashboards for our application services.
Each service dashboard is based on a common template that provides a combination of useful metrics, visualisations and links to canned searches / queries. A screenshot of an example of the dashboard is shown below –
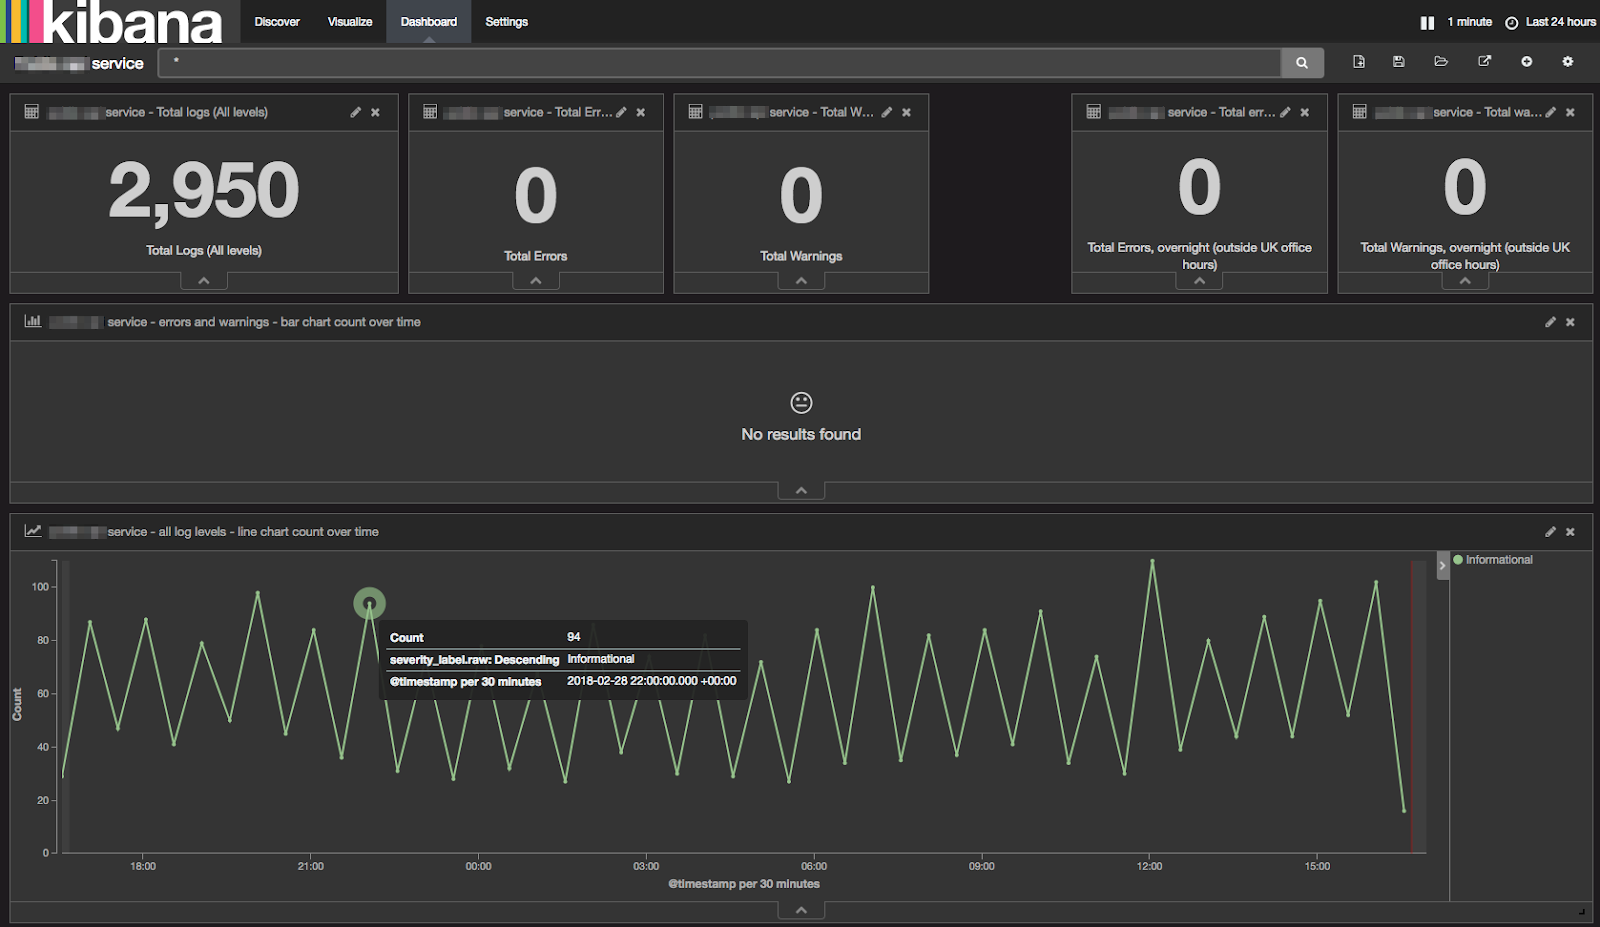
Reporting Period & Refresh Interval – All of the log metrics and visualisations displayed on the dashboard are specific to the Kibana reporting period, selected in the top-right e.g. “Last 24 hours”. The displayed data updates automatically at a configured refresh interval, also selected in the top-right, e.g. “1 min”.
Counters – The top-row of the dashboard contains counters for the total no. of logs written by the application, broken down by errors and warnings.
Visualisation of Rate of Logged Errors & Warnings Over Time – The second row of the dashboard provides a visualisation (in the form of a histogram) of the errors and warnings logged by the service over time. (In the example above, this is empty, as there have been no errors or warnings logged during the reporting period). This now allows us to spot spikes of logged significant issues in the given reporting period.
Visualisation of Rate of All Logs Over Time – The 3rd row of the dashboard provides a visualisation (in the form of a line chart) of the rate of all events logged by the service over time. This allows us to used to spot spikes in the rate of events being logged by a service, which can be one indicator of whether it’s under abnormal load (e.g. processing abnormal numbers of requests).
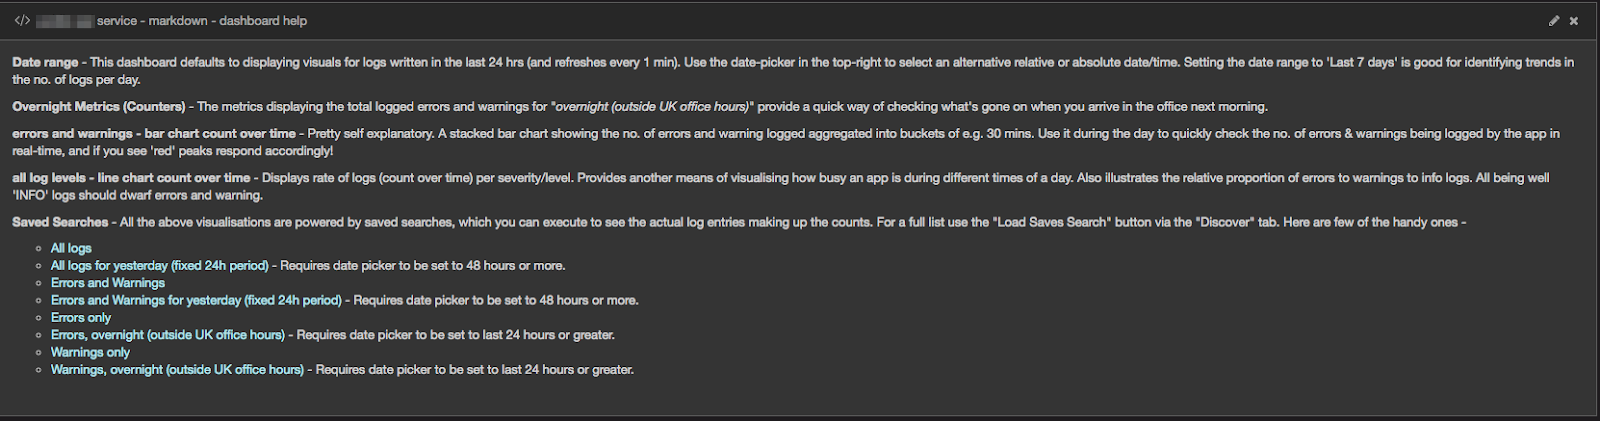
Dashboard Help & Links – The final section of the dashbord contains some help-text providing further guidance on how to use it. It also contains links to some commonly required searches for displaying the actual logged events for this particular service. The following screenshot shows an example of using one the bookmarked links to search for logs written by a particular service, in a specified period –
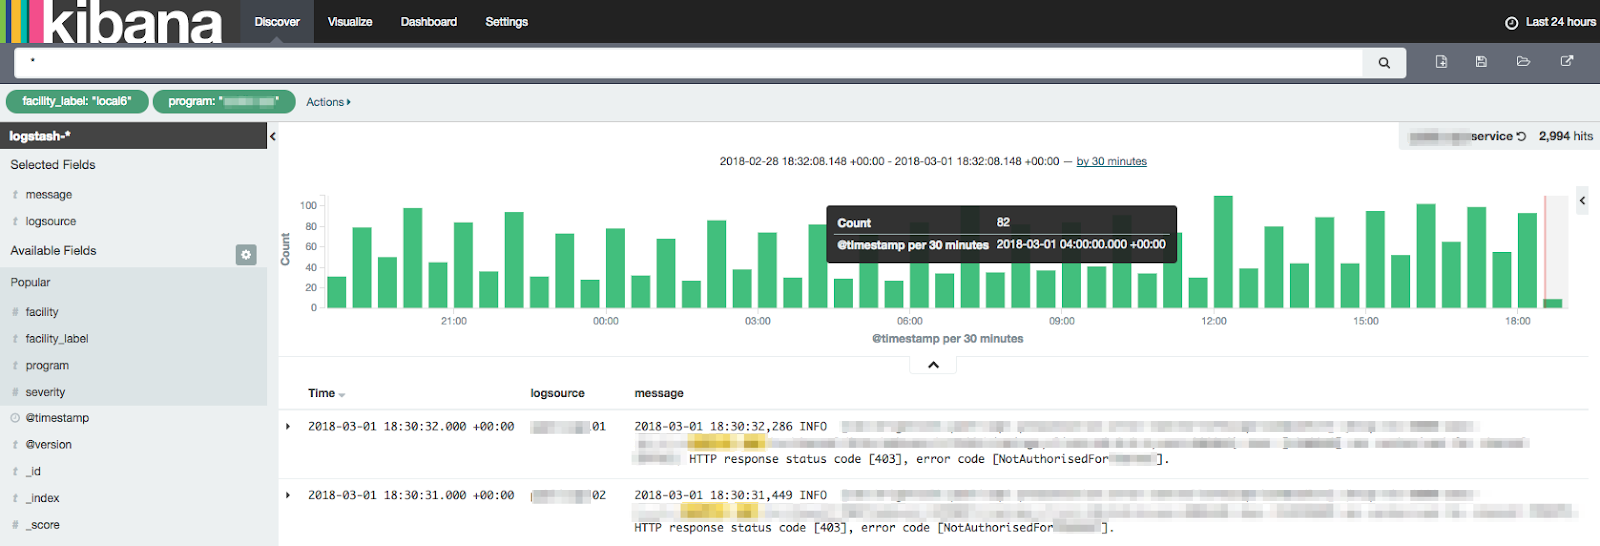 The search results are displayed in the standard Kibana search results page. At the top of the page is a histogram showing the count of the no. of logs written in buckets of 30 minute intervals. Below the chart is a pageable list of each of the matched log records, displayed by default in created timestamp descending order (most recent first).
Benefits
The new solution described above has addressed our original problems, and also delivered some additional benefits.
1) Simpler, more convenient viewing of logs – Logs written by all instances of all our application services are easier to view than before, for anyone on the team, via a single, central web UI. There’s no longer a need to log into log servers and tail multiple per node log files.
2) Better performing & more powerful log search – Switching to storing logs in Elasticsearch add adding the required indexes, has solved the performance problem we had searching for logs – searches results are returned in an instant. In addition, the switch to Kibana, and its tight integration with Elasticsearch, has also given us more ways to query logs. Full-text searches support regular expressions and can be combined with filters on more fields, whilst still performing well. For example, we cn query all logs with a severity of error or warning, that occurred in the last ‘n’ seconds, that optionally contained a message matching a specified pattern.
3) Visualisation of rates & trends in logs – The custom log dashboards we have been able to create using Kibana have several benefits –
- They provide a real-time summary display of the current or recent operational status of an app, in terms of no. and rate of errors, warnings and informational events logged. This highlights unusual spikes in logs, whether due to a problem or increased load.
- When the dashboard reporting period is adjusted to days or weeks, the graphs provide additional insight into the trends in logging, such as the rate of logs at different times of the day, and how it compares to the norm.
- The dashboard is powered by, and provides bookmarked links to those searches that are most useful when first starting to troubleshoot an issue with a service.
In summary, the new solution is easier to use, performs better and is functionally more powerful than the previous solution. In addition to more efficient filtering and searching of logs, there are now also features to visualise and report on trends in logs.
Further Work
At the time of writing we have yet to add support for automating the monitoring of logs using alerts & notifications functionality. This is an important additional feature as it can be used to ensure the team does not miss incidents, as indicated by logged errors or warnings, and allow them to respond more quickly to them to mitigate impact on users. It will also remove the manual effort and drudgery of needing to monitoring the logs for such incidents. At the time of writing, there appears to be a few candidate solutions for alerts & notifications functionality that are worth trialling –
- Elasticsearch Alerts – Elastic, the company behind the ELK stack, offer a premium feature called ‘Alerting’ that is design to satisfy the requirement. It supports monitoring the data stored in Elasticsearch for described changes, and when they occur sending notifications (via email or other channels e.g. Slack). For more details see this page.
- ElastAlert by Yelp – ElastAlert is an open-source tool developed by Yelp that is also designed to support monitoring data stored in Elasticsearch for changes in real-time and sending notifications when the changes meet certain conditions. It is deployed and runs separately from Elasticsearch. For more details the online docs and GitHub project.
- Grafana Alerts for Elasticsearch – If you use Grafana, it already supports building graphs of data stored in Elasticsearch. And it is in the process of being enhanced to support defining alerts when the graphed data exceeds or falls below a defined threshold. See Grafana enhancement “Add elasticsearch alerting”, which is currently scheduled for inclusion in Grafana 5.2.
I hope you found this post of interest, or useful if you’re looking to improve your own logging infrastructure.
